Market Outlook
November 11, 2016
Market Cues
Domestic Indices
Chg (%)
(Pts)
(Close)
Indian markets are likely to open negative note tracking SGX Nifty. However global
BSE Sensex
1.0
265
27,518
markets overnight have been strong and hence sharp negativity is unlikely to stay for
Nifty
1.1
94
8,526
a long.
Mid Cap
1.7
210
12,932
Small Cap
1.8
223
12,927
After witnessing sharp volatility in the last two days, Indian markets extended its gain
yesterday. Banking stocks saw huge buying on the expectations that huge sum of
Bankex
3.6
811
23,186
deposits in the coming days will increase the liquidity and reduce cost of funds for
them. Further the RBI has come out with a new norm of S4A scheme, which should
Global Indices
Chg (%)
(Pts)
(Close)
allow banks to accelerate in resolution of the troubled assets hence banking stocks
Dow Jones
1.2
218
18,808
could extend their rally.
Nasdaq
(0.8)
(42)
5,209
The US markets closed on a mixed note, while Dowjones closed higher, NASADAQ
FTSE
(1.2)
(83)
6,828
closed on a negative note. On the other hand European markets closed down and
Nikkei
6.7
1,093
17,344
selling pressure was witnessed. FTSE closed down
1.2%, while
DAX closed
Hang Seng
1.9
424
22,839
marginally lower by 0.15%.
Shanghai Com
1.4
43
3,171
Result Previews & Review
Result Review - Sun Pharma Q2FY17
Advances / Declines
BSE
NSE
Detailed analysis on Pg2
Advances
2,040
1309
Investor’s Ready Reckoner
Declines
731
334
Unchanged
130
56
Key Domestic & Global Indicators
Stock Watch: Latest investment recommendations on 150+ stocks
Volumes (` Cr)
Refer Pg6 onwards
BSE
3,737
Top Picks
NSE
27,196
CMP
Target
Upside
Company
Sector
Rating
(`)
(`)
(%)
Amara Raja BatteriesAuto & Auto Ancill.
Buy
1,011
1,167
15.4
Net Inflows (` Cr)
Net
Mtd
Ytd
HCL Tech
IT
Buy
788
1,000
26.9
FII
(733)
(4272)
45,381
Asian Granito
Capital Goods
Buy
258
351
36.2
MFs
639
5054
25,047
Equitas Holdings
Financials
Buy
167
235
41.1
Navkar Corporation Others
Buy
194
265
36.9
More Top Picks on Pg4
Top Gainers
Price (`)
Chg (%)
Welcorp
73
19.9
Key Upcoming Events
Previous
Consensus
Indianb
269
18.2
Date
Region
Event Description
Reading
Expectations
Bankindia
124
13.0
Nov 11 India
Industrial Production YoY
(0.7)
0.6
Denabank
38
12.9
Nov 13 India
Exports YoY %
4.6
--
Pnb
159
11.9
Nov 13 India
Imports YoY %
(2.5)
--
Nov 14 China
Industrial Production (YoY)
6.1
6.2
Nov 15 UK
CPI (YoY)
1.0
1.2
Top Losers
Price (`)
Chg (%)
Nov 15 India
Monthly Wholesale Prices YoY%
3.6
3.7
Cholafin
988
(7.5)
Nov 15 Euro Zone Euro Zone GDP s.a. (QoQ)
0.3
--
3.696.(
Pageind
14,978
(6.9)
More Events on Pg5
Deltacorp
121
(6.7)
Bajajelec
231
(5.6)
Prestige
172
(5.2)
As on November 10, 2016
Market Outlook
November 11, 2016
Result Review
Sun Pharma (CMP: `667 / TP: `944 /Upside: 41.5%)
Sun Pharma, posted numbers better than expected on OPM and the net profit
front. It posted sales of
`7,764cr V/s
`7,800cr expected V/s
`6,803cr in
2QFY2016, posting a yoy growth of 14.1%. India sales at `2,009cr, was up by
11% yoy. US finished dosage sales at US$555mn was up by 9% yoy. Emerging
Markets sales at US$170mn up by 22% yoy. Rest of World (ROW), sales at US$
79mn, growth of 3% yoy. On operating front, the EBITDA margins, came in at
34.3% V/s 30.1% expected and V/s 28.0% in 2QFY2016. Apart from the gross
margin expansion (which came in at
76.3% in 2QFY2017 V/s
73.7% in
2QFY2016), lower expenses during the quarter aided the OPM expansion.
Employee expenses, during the quarter posted a decline of 2.0% and other
expenses posted a dip of 8.0%. The R&D expenses came in at 7.3% of sales, same
in line with last year, posting a yoy growth of 14.0%. Consequently, Adj. PAT came
in at `2,471cr V/s `1,545cr expected V/s `1,107cr in 2QFY2016, yoy growth of
123.3%. Apart from better than expected OPM, the company also posted higher
than expected other income (`621cr in 2QFY2017 V/s `226cr in 2QFY2016). We
maintain our buy rating on the stock.
Y/E
Sales OPM
PAT
EPS ROE P/E P/BV EV/EBITDA EV/Sales
March
(` cr)
(%)
(` cr)
(`)
(%)
(x)
(x)
(x)
(x)
FY2017E
31,129
30.0
6,735
28.0
18.7
23.8
3.6
16.0
4.8
FY2018E
35,258
30.9
7,895
32.8
18.9
20.3
3.0
13.1
4.1
Economic and Political News
India to take up Visa, trade issues with new Donald Trump administration
IMF supports India’s fight on black money
Bangladesh to ease biz rules to attract Indian investors
Corporate News
Bank Of India reports PAT of `127cr in Q2FY17
Motherson Sumi’s Q2FY17 net up 25% at `361cr
Cyrus Mistry gets backing of Tata Chemicals independent directors
Market Outlook
November 11, 2016
Quarterly Bloomberg Brokers Consensus Estimate
Mahindra & Mahindra Ltd - Nov 11, 2016
Particulars ( ` cr)
2QFY17E
2QFY16
y-o-y (%)
1QFY17
q-o-q (%)
Net sales
11,126
9,122
22.0
10,898
2.1
EBITDA
1,477
1,026
43.9
1,286
14.9
EBITDA margin (%)
13.3
11.3
11.8
Net profit
898
924
(2.8)
1,014
(11.5)
Bharat Petroleum Corp Ltd - Nov 11, 2016
Particulars ( ` cr)
2QFY17E
2QFY16
y-o-y (%)
1QFY17
q-o-q (%)
Net sales
49,977
46,423
7.7
46,890
6.6
EBITDA
3,485
1,568
122.2
4,085
(14.7)
EBITDA margin (%)
7.0
3.4
8.7
Net profit
2,172
1,018
113.4
2,621
(17.1)
Tata Steel Ltd Consol- Nov 11, 2016
Particulars ( ` cr)
2QFY17E
2QFY16
y-o-y (%)
1QFY17
q-o-q (%)
Net sales
28,730
29,069
(1.2)
25,156
14.2
EBITDA
3,067
1,830
67.5
3,242
(5.4)
EBITDA margin (%)
10.7
6.3
12.9
Net profit
392
1,529
(74.4)
(3183)
87.7
Bank Of Baroda Ltd - Nov 11, 2016
Particulars ( ` cr)
2QFY17E
2QFY16
y-o-y (%)
1QFY17
q-o-q (%)
Net profit
432
124
246.8
424
1.9
Reliance Power Ltd Consol- Nov 11, 2016
Particulars ( ` cr)
2QFY17E
2QFY16
y-o-y (%)
1QFY17
q-o-q (%)
Net sales
2,854
2,766
3.2
2,679
6.5
EBITDA
1,293
1,221
5.9
1,142
13.2
EBITDA margin (%)
45.3
44.1
42.6
Net profit
337
346
(2.4)
340
(0.9)
State Bank of India Ltd - Nov 11, 2016
Particulars ( ` cr)
2QFY17E
2QFY16
y-o-y (%)
1QFY17
q-o-q (%)
Net profit
2,471
3,879
(36.3)
2,521
(2.0)
Market Outlook
November 11, 2016
Top Picks ★★★★★
Large Cap
Market Cap
CMP
Target
Upside
Company
Rationale
(` Cr)
(`)
(`)
(%)
To outpace battery industry growth due to better technological
Amara Raja Batteries
17,271
1,011
1,167
15.4
products leading to market share gains in both the
automotive OEM and replacement segments.
The stock is trading at attractive valuations and is factoring all
HCL Tech
1,11,189
788
1,000
26.9
the bad news.
Back on the growth trend, expect a long term growth of 14%
Infosys
2,15,591
939
1,249
33.0
to be a US$20bn in FY2020.
Source: Company, Angel Research
Mid Cap
Market Cap
CMP
Target
Upside
Company
Rationale
(` Cr)
(`)
(`)
(%)
We expect the company would report strong profitability
Asian Granito
776
258
351
36.2
owing to better product mix, higher B2C sales and
amalgamation synergy.
Among the top 4 players in the consumer durables segment.
Bajaj Electricals
2,333
231
306
32.6
Improved profitability backed by turn around in E&P segment.
Strong order book lends earnings visibility.
Favourable outlook for the AC industry to augur well for
Cooling products business which is out pacing the market
Blue Star
5,036
528
634
20.0
growth. EMPPAC division's profitability to improve once
operating environment turns around.
With a focus on the low and medium income (LMI) consumer
Dewan Housing Finance
8,604
275
350
27.3
segment, the company has increased its presence in tier-II &
III cities where the growth opportunity is immense.
Strong loan growth backed by diversified loan portfolio and
Equitas Holdings
5,587
167
235
41.1
adequate CAR. ROE & ROA likely to remain decent as risk of
dilution remains low. Attractive valuations considering growth.
Economic recovery to have favourable impact on advertising
& circulation revenue growth. Further, the acquisition of a
Jagran Prakashan
6,126
187
225
20.1
radio business (Radio City) would also boost the company's
revenue growth.
Speedier execution and speedier sales, strong revenue visibilty
Mahindra Lifespace
1,700
414
522
26.0
in short-to-long run, attractive valuations
We expect the company to report strong growth on back of
healthy growth in domestic branded sales (owing to
Mirza International
1,071
89
113
26.9
aggressive ad spend and addition in the number of EBOs &
multi-brand outlets [MBOs]) and healthy export revenues.
Massive capacity expansion along with rail advantage at ICD
Navkar Corporation
2,761
194
265
36.9
as well CFS augurs well for the company.
Strong brands and distribution network would boost growth
Siyaram Silk Mills
1,297
1,383
1,714
23.9
going ahead. Stock currently trades at an inexpensive
valuation.
Market leadership in Hindi news genre and no. 2 viewership
ranking in English news genre, exit from the radio business,
TV Today Network
2,012
337
385
14.1
and anticipated growth in ad spends by corporates to benefit
the stock.
Source: Company, Angel Research
Market Outlook
November 11, 2016
Key Upcoming Events
Result Calendar
Date
Company
M&M, FAG Bearings, Suzlon Energy, St Bk of India, Bank of Baroda, Andhra Bank, IOB, Tata Steel, MOIL, BPCL,
November 11, 2016
Styrolution, Ipca labs, Reliance Power, MT Educare, Quick Heal
November 12, 2016
J & K Bank, Hindalco, Banco, Divi's Lab., Reliance Infra., PTC India
November 14, 2016
Tata Motors, Corporation Bank, Aurobindo Pharma, Coffee Day Enterprises Ltd, S H Kelkar & Co.
November 15, 2016
Tata Global, GAIL, HPCL
Source: Bloomberg, Angel Research
Global economic events release calendar
Bloomberg Data
Date
Time
Country
Event Description
Unit
Period
Last Reported
Estimated
Nov 11, 2016
5:30 PM
India
Industrial Production YoY
% Change Sep
(0.70)
0.60
Nov 13, 2016
India
Exports YoY%
% Change Oct
4.60
India
Imports YoY%
% Change Oct
(2.50)
Nov 14, 2016
7:30 AM
China
Industrial Production (YoY)
% Change Oct
6.10
6.20
Nov 15, 2016
3:00 PM
UK
CPI (YoY)
% Change Oct
1.00
1.20
12:00 PM
India
Monthly Wholesale Prices YoY%
% Change Oct
3.57
3.74
3:30 PM Euro Zone
Euro-Zone GDP s.a. (QoQ)
% Change 3Q P
0.30
12:30 PM Germany
GDP nsa (YoY)
% Change 3Q P
3.10
Nov 16, 2016
3:00 PM
UK
Jobless claims change
% Change Oct
0.70
2.00
7:45 PM
US
Industrial Production
% Oct
0.06
0.20
US
Producer Price Index (mom)
% Change Oct
0.80
Nov 17, 2016
7:00 PM
US
Housing Starts
Thousands
Oct
1,047.00
1,160.00
7:00 PM
US
Building permits
Thousands
Oct
1,225.00
1,190.00
7:00 PM
US
Consumer price index (mom)
% Change Oct
0.30
0.40
3:30 PM Euro Zone
Euro-Zone CPI (YoY)
% Oct F
0.50
Nov 22, 2016
8:30 PM Euro Zone Euro-Zone Consumer Confidence
Value Nov A
(8.00)
2:00 PM Germany
PMI Services
Value Nov P
54.20
Nov 23, 2016
8:30 PM
US
Existing home sales
Million
Oct
5.47
2:00 PM Germany
PMI Manufacturing
Value Nov P
55.00
Source: Bloomberg, Angel Research
Market Outlook
November 11, 2016
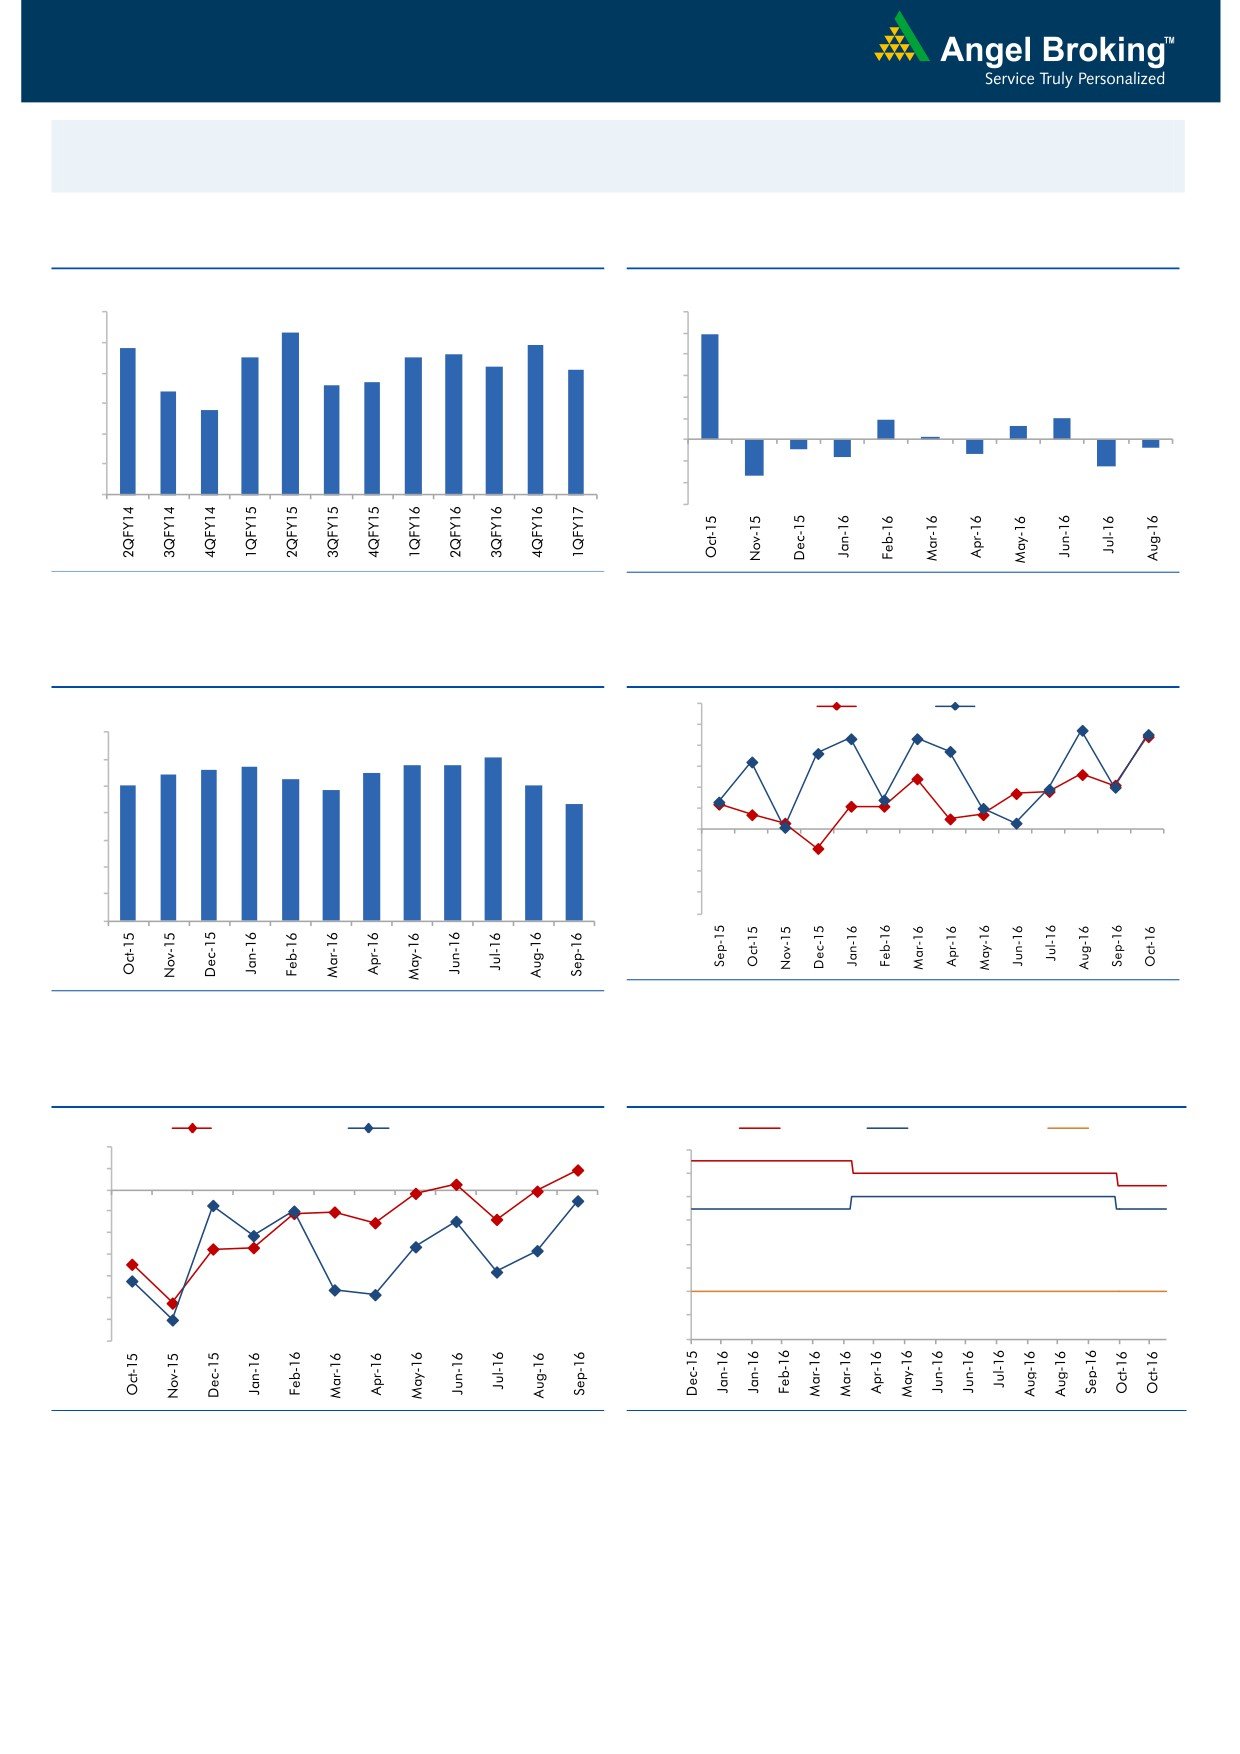
Macro watch
Exhibit 1: Quarterly GDP trends
Exhibit 2: IIP trends
(%)
(%)
9.0
12.0
8.3
9.9
7.8
7.9
10.0
8.0
7.5
7.5
7.6
7.2
7.1
8.0
6.6
6.7
7.0
6.4
6.0
5.8
6.0
4.0
1.9
2.0
1.3
2.0
0.3
5.0
-
4.0
(2.0)
(0.7)
(0.9)
(1.3)
(1.6)
(4.0)
(2.5)
3.0
(3.4)
(6.0)
Source: CSO, Angel Research
Source: MOSPI, Angel Research
Exhibit 3: Monthly CPI inflation trends
Exhibit 4: Manufacturing and services PMI
56.0
Mfg. PMI
Services PMI
(%)
55.0
7.0
6.1
54.0
5.6
5.7
5.8
5.8
6.0
5.4
5.5
5.0
5.3
5.1
53.0
4.8
5.0
4.3
52.0
4.0
51.0
50.0
3.0
49.0
2.0
48.0
1.0
47.0
46.0
-
Source: Market, Angel Research; Note: Level above 50 indicates expansion
Source: MOSPI, Angel Research
Exhibit 5: Exports and imports growth trends
Exhibit 6: Key policy rates
(%)
Exports yoy growth
Imports yoy growth
(%)
Repo rate
Reverse Repo rate
CRR
10.0
7.00
5.0
6.50
0.0
6.00
(5.0)
5.50
(10.0)
5.00
(15.0)
4.50
(20.0)
4.00
(25.0)
(30.0)
3.50
(35.0)
3.00
Source: Bloomberg, Angel Research
Source: RBI, Angel Research
Stock Watch
November 11, 2016
Company Name
Reco
CMP
Target
Mkt Cap
Sales ( Čcr )
OPM(%)
EPS (Č)
PER(x)
P/BV(x)
RoE(%)
EV/Sales(x)
(Č)
Price ( Č)
( Č cr )
FY17E FY18E
FY17E
FY18E
FY17E
FY18E
FY17E
FY18E
FY17E
FY18E
FY17E
FY18E
FY17E
FY18E
Agri / Agri Chemical
Rallis
Accumulate
199
209
3,875
1,937
2,164
13.3
14.3
9.0
11.0
22.1
18.1
3.9
3.4
18.4
19.8
2.0
1.8
United Phosphorus
Neutral
695
-
35,216
15,176
17,604
18.5
18.5
37.4
44.6
18.6
15.6
3.6
3.0
21.4
21.2
2.3
2.0
Auto & Auto Ancillary
Ashok Leyland
Buy
89
111
25,456
22,407
26,022
10.6
10.6
5.2
6.4
17.2
13.9
3.9
3.3
23.6
24.7
1.2
1.0
Bajaj Auto
Neutral
2,735
-
79,151
25,093
27,891
19.5
19.2
143.9
162.5
19.0
16.8
5.3
4.6
30.3
29.4
2.9
2.6
Bharat Forge
Neutral
882
-
20,534
7,726
8,713
20.5
21.2
35.3
42.7
25.0
20.7
4.6
4.2
18.9
20.1
2.7
2.3
Eicher Motors
Neutral
23,066
-
62,651
16,583
20,447
17.5
18.0
598.0
745.2
38.6
31.0
13.2
10.0
41.2
38.3
3.6
2.9
Gabriel India
Accumulate
123
130
1,760
1,544
1,715
9.0
9.3
5.4
6.3
22.7
19.5
4.3
3.8
18.9
19.5
1.1
0.9
Hero Motocorp
Accumulate
3,145
3,541
62,793
30,958
34,139
15.7
15.7
193.6
208.3
16.2
15.1
6.4
5.3
34.2
30.5
1.9
1.7
Jamna Auto Industries Neutral
209
-
1,673
1,486
1,620
9.8
9.9
15.0
17.2
14.0
12.2
3.1
2.6
21.8
21.3
1.2
1.1
L G Balakrishnan & Bros Neutral
632
-
992
1,302
1,432
11.6
11.9
43.7
53.0
14.5
11.9
2.0
1.9
13.8
14.2
0.9
0.8
Mahindra and Mahindra Neutral
1,321
-
82,068
46,534
53,077
11.6
11.7
67.3
78.1
19.6
16.9
3.2
2.8
15.4
15.8
1.8
1.5
Maruti
Accumulate
5,325
6,006
160,852
68,057
82,958
15.8
15.5
212.1
261.2
25.1
20.4
5.0
4.1
19.8
20.3
2.1
1.6
Minda Industries
Neutral
361
-
2,861
2,728
3,042
9.0
9.1
68.2
86.2
5.3
4.2
1.2
1.0
23.8
24.3
1.1
1.0
Motherson Sumi
Neutral
326
-
45,800
45,896
53,687
7.8
8.3
13.0
16.1
25.0
20.3
8.1
6.4
34.7
35.4
1.0
0.8
Rane Brake Lining
Neutral
1,013
-
802
511
562
11.3
11.5
28.1
30.9
36.1
32.8
5.5
5.0
15.3
15.0
1.7
1.6
Setco Automotive
Neutral
41
-
545
741
837
13.0
13.0
15.2
17.0
2.7
2.4
0.4
0.4
15.8
16.3
1.1
1.0
Tata Motors
Neutral
534
-
154,220
300,209
338,549
8.9
8.4
42.7
54.3
12.5
9.9
2.0
1.7
15.6
17.2
0.6
0.5
TVS Motor
Neutral
379
-
18,015
13,390
15,948
6.9
7.1
12.8
16.5
29.7
22.9
7.4
5.9
26.3
27.2
1.4
1.1
Amara Raja Batteries
Buy
1,011
1,218
17,271
5,429
6,471
17.5
17.6
35.3
43.5
28.6
23.2
6.6
5.3
25.3
24.8
3.0
2.4
Exide Industries
Neutral
193
-
16,422
7,439
8,307
15.0
15.0
8.1
9.3
23.9
20.8
3.3
3.0
14.3
16.7
1.8
1.6
Apollo Tyres
Buy
196
235
9,967
12,877
14,504
14.3
13.9
21.4
23.0
9.1
8.5
1.4
1.2
16.4
15.2
0.9
0.9
Ceat
Accumulate
1,328
1,450
5,370
7,524
8,624
13.0
12.7
131.1
144.3
10.1
9.2
1.9
1.6
19.8
18.6
0.8
0.7
JK Tyres
Neutral
145
-
3,287
7,455
8,056
15.0
15.0
21.8
24.5
6.7
5.9
1.4
1.1
22.8
21.3
0.6
0.5
Swaraj Engines
Neutral
1,370
-
1,702
660
810
15.2
16.4
54.5
72.8
25.1
18.8
7.8
7.1
31.5
39.2
2.5
2.0
Subros
Neutral
164
-
984
1,488
1,681
11.7
11.9
6.4
7.2
25.6
22.9
2.7
2.5
10.8
11.4
0.9
0.8
Indag Rubber
Neutral
187
-
490
286
326
19.8
16.8
11.7
13.3
16.0
14.0
2.7
2.5
17.8
17.1
1.3
1.1
Capital Goods
ACE
Neutral
51
-
502
709
814
4.1
4.6
1.4
2.1
36.2
24.1
1.5
1.4
4.4
6.0
0.8
0.7
BEML
Neutral
908
-
3,781
3,451
4,055
6.3
9.2
31.4
57.9
28.9
15.7
1.7
1.6
6.3
10.9
1.2
1.0
Bharat Electronics
Accumulate
1,363
1,414
32,722
8,137
9,169
16.8
17.2
58.7
62.5
23.2
21.8
3.6
3.2
44.6
46.3
2.8
2.5
Stock Watch
November 11, 2016
Company Name
Reco
CMP
Target
Mkt Cap
Sales ( Čcr )
OPM(%)
EPS (Č)
PER(x)
P/BV(x)
RoE(%)
EV/Sales(x)
(Č)
Price ( Č)
( Č cr )
FY17E
FY18E
FY17E
FY18E
FY17E
FY18E
FY17E
FY18E
FY17E
FY18E
FY17E
FY18E
FY17E
FY18E
Capital Goods
Voltas
Buy
350
407
11,584
6,511
7,514
7.9
8.7
12.9
16.3
27.1
21.5
4.9
4.3
16.7
18.5
1.5
1.2
BGR Energy
Neutral
114
-
819
16,567
33,848
6.0
5.6
7.8
5.9
14.6
19.3
0.8
0.8
4.7
4.2
0.2
0.1
BHEL
Neutral
141
-
34,425
28,797
34,742
-
2.8
2.3
6.9
61.2
20.4
1.0
1.0
1.3
4.8
0.8
0.6
Blue Star
Buy
528
634
5,036
4,283
5,077
5.9
7.3
14.9
22.1
35.5
23.9
6.9
5.8
20.4
26.4
1.2
1.0
Crompton Greaves
Neutral
82
-
5,139
5,777
6,120
5.9
7.0
3.3
4.5
24.9
18.2
1.1
1.0
4.4
5.9
0.8
0.7
Greaves Cotton
Neutral
129
-
3,159
1,755
1,881
16.8
16.9
7.8
8.5
16.6
15.2
3.3
3.1
20.6
20.9
1.5
1.4
Inox Wind
Neutral
208
-
4,620
5,605
6,267
15.7
16.4
24.8
30.0
8.4
6.9
2.3
1.7
25.9
24.4
0.8
0.7
KEC International
Neutral
140
-
3,602
9,294
10,186
7.9
8.1
9.9
11.9
14.2
11.8
2.1
1.8
15.6
16.3
0.6
0.5
Thermax
Neutral
873
-
10,402
5,421
5,940
7.3
7.3
25.7
30.2
34.0
28.9
4.1
3.8
12.2
13.1
1.7
1.6
VATech Wabag
Buy
524
681
2,857
3,136
3,845
8.9
9.1
26.0
35.9
20.2
14.6
2.5
2.2
13.4
15.9
0.8
0.6
Cement
ACC
Neutral
1,459
-
27,392
11,225
13,172
13.2
16.9
44.5
75.5
32.8
19.3
3.1
2.9
11.2
14.2
2.4
2.1
Ambuja Cements
Neutral
231
-
45,809
9,350
10,979
18.2
22.5
5.8
9.5
39.8
24.3
3.3
3.0
10.2
12.5
4.9
4.2
India Cements
Neutral
143
-
4,379
4,364
4,997
18.5
19.2
7.9
11.3
18.0
12.6
1.3
1.3
8.0
8.5
1.8
1.6
JK Cement
Neutral
876
-
6,128
4,398
5,173
15.5
17.5
31.2
55.5
28.1
15.8
3.4
2.9
12.0
15.5
1.9
1.6
J K Lakshmi Cement
Buy
447
565
5,265
2,913
3,412
14.5
19.5
7.5
22.5
59.7
19.9
3.7
3.1
12.5
18.0
2.4
2.0
Orient Cement
Buy
151
215
3,094
2,114
2,558
18.5
20.5
8.1
11.3
18.6
13.4
2.8
2.3
9.0
14.0
2.2
1.7
UltraTech Cement
Neutral
3,841
-
105,417
25,768
30,385
21.0
23.5
111.0
160.0
34.6
24.0
4.4
3.9
13.5
15.8
4.1
3.4
Construction
ITNL
Neutral
101
-
3,324
8,946
10,017
31.0
31.6
8.1
9.1
12.5
11.1
0.5
0.5
4.2
5.0
3.7
3.4
KNR Constructions
Buy
721
802
2,027
1,385
1,673
14.7
14.0
41.2
48.5
17.5
14.9
3.3
2.8
14.9
15.2
1.5
1.2
Larsen & Toubro
Buy
1,414
1,700
131,753
67,665
77,249
10.7
11.5
57.3
71.2
24.7
19.9
2.3
2.1
12.6
14.3
2.1
1.8
Gujarat Pipavav Port
Neutral
156
-
7,549
705
788
52.2
51.7
5.0
5.6
31.2
27.9
3.1
2.8
11.2
11.2
10.6
9.0
Nagarjuna Const.
Neutral
81
-
4,511
8,842
9,775
9.1
8.8
5.3
6.4
15.3
12.7
1.2
1.1
8.2
9.1
0.7
0.6
PNC Infratech
Buy
117
143
2,998
2,350
2,904
13.1
13.2
9.0
8.8
13.0
13.3
0.5
0.4
15.9
13.9
1.4
1.1
Simplex Infra
Neutral
318
-
1,571
6,829
7,954
10.5
10.5
31.4
37.4
10.1
8.5
1.1
1.0
9.9
13.4
0.6
0.5
Power Mech Projects
Neutral
475
-
699
1,801
2,219
12.7
14.6
72.1
113.9
6.6
4.2
1.2
1.0
16.8
11.9
0.4
0.3
Sadbhav Engineering
Accumulate
275
298
4,713
3,598
4,140
10.3
10.6
9.0
11.9
30.5
23.1
3.2
2.8
9.9
11.9
1.6
1.4
NBCC
Neutral
232
-
13,941
7,428
9,549
7.9
8.6
8.2
11.0
28.3
21.1
1.4
1.1
28.2
28.7
1.5
1.1
MEP Infra
Neutral
39
-
632
1,877
1,943
30.6
29.8
3.0
4.2
13.0
9.3
6.3
4.2
0.6
0.6
1.7
1.6
SIPL
Neutral
100
-
3,526
1,036
1,252
65.5
66.2
(8.4)
(5.6)
3.8
4.3
(22.8)
(15.9)
11.5
9.6
Stock Watch
November 11, 2016
Company Name
Reco
CMP
Target
Mkt Cap
Sales ( Čcr )
OPM(%)
EPS (Č)
PER(x)
P/BV(x)
RoE(%)
EV/Sales(x)
(Č)
Price ( Č)
( Č cr )
FY17E
FY18E
FY17E
FY18E
FY17E
FY18E
FY17E
FY18E
FY17E
FY18E
FY17E
FY18E
FY17E
FY18E
Construction
Engineers India
Neutral
268
-
9,032
1,725
1,935
16.0
19.1
11.4
13.9
23.5
19.3
3.2
3.1
13.4
15.3
4.1
3.7
Financials
Axis Bank
Buy
507
630
120,901
46,932
53,575
3.5
3.4
32.4
44.6
15.7
11.4
2.0
1.8
13.6
16.5
-
-
Bank of Baroda
Neutral
165
-
37,973
19,980
23,178
1.8
1.8
11.5
17.3
14.3
9.5
1.6
1.4
8.3
10.1
-
-
Canara Bank
Neutral
321
-
17,406
15,225
16,836
1.8
1.8
14.5
28.0
22.1
11.5
1.5
1.2
5.8
8.5
-
-
Dewan Housing Finance Buy
275
350
8,604
2,225
2,688
2.9
2.9
29.7
34.6
9.3
7.9
1.5
1.3
16.1
16.8
-
-
Equitas Holdings
Buy
167
235
5,587
939
1,281
11.7
11.5
5.8
8.2
28.7
20.3
2.5
2.2
10.9
11.5
-
-
Federal Bank
Neutral
80
-
13,814
9,353
10,623
2.9
2.9
4.4
5.8
18.3
13.9
1.8
1.6
9.5
11.0
-
-
HDFC
Neutral
1,332
-
210,592
11,475
13,450
3.4
3.4
45.3
52.5
29.4
25.4
5.7
5.0
20.2
20.5
-
-
HDFC Bank
Accumulate
1,276
1,350
323,101
46,097
55,433
4.5
4.5
58.4
68.0
21.9
18.8
3.8
3.2
18.8
18.6
-
-
ICICI Bank
Neutral
293
-
170,239
39,029
45,903
3.3
3.3
16.7
16.3
17.5
18.0
2.2
2.0
10.1
12.4
-
-
LIC Housing Finance
Buy
552
630
27,845
3,712
4,293
2.6
2.5
39.0
46.0
14.2
12.0
2.7
2.3
19.9
20.1
-
-
Punjab Natl.Bank
Neutral
159
-
33,909
23,532
23,595
2.3
2.4
6.8
12.6
23.4
12.7
3.6
2.6
3.3
6.5
-
-
RBL Bank
Neutral
381
-
14,086
1,783
2,309
2.6
2.6
12.7
16.4
30.0
23.2
3.3
2.9
12.8
13.3
-
-
South Ind.Bank
Neutral
24
-
3,227
6,435
7,578
2.5
2.5
2.7
3.1
8.9
7.7
1.1
1.0
10.1
11.2
-
-
St Bk of India
Neutral
282
-
218,600
88,650
98,335
2.6
2.6
13.5
18.8
20.9
15.0
2.0
1.7
7.0
8.5
-
-
Union Bank
Neutral
143
-
9,827
13,450
14,925
2.3
2.3
25.5
34.5
5.6
4.1
0.8
0.7
7.5
10.2
-
-
Yes Bank
Neutral
1,291
-
54,338
8,978
11,281
3.3
3.4
74.0
90.0
17.4
14.3
3.3
2.8
17.0
17.2
-
-
FMCG
Asian Paints
Neutral
1,015
-
97,311
17,128
18,978
16.8
16.4
19.1
20.7
53.1
49.0
18.5
17.4
34.8
35.5
5.8
5.2
Britannia
Buy
3,201
3,626
38,402
9,795
11,040
14.6
14.9
80.3
94.0
39.9
34.1
16.4
12.7
41.2
-
3.7
3.2
Colgate
Neutral
964
-
26,215
4,605
5,149
23.4
23.4
23.8
26.9
40.5
35.8
22.4
17.5
64.8
66.8
5.7
5.0
Dabur India
Neutral
297
-
52,176
8,315
9,405
19.8
20.7
8.1
9.2
36.6
32.2
10.2
8.5
31.6
31.0
5.9
5.2
GlaxoSmith Con*
Neutral
5,573
-
23,435
4,350
4,823
21.2
21.4
179.2
196.5
31.1
28.4
8.3
7.0
27.1
26.8
4.9
4.4
Godrej Consumer
Neutral
1,505
-
51,235
10,235
11,428
18.4
18.6
41.1
44.2
36.6
34.0
8.1
6.9
24.9
24.8
5.0
4.4
HUL
Neutral
822
-
177,825
35,252
38,495
17.8
17.8
20.7
22.4
39.8
36.7
38.0
32.6
95.6
88.9
4.9
4.5
ITC
Accumulate
251
284
302,736
40,059
44,439
38.3
39.2
9.0
10.1
27.9
24.8
7.8
6.8
27.8
27.5
7.0
6.3
Marico
Accumulate
267
300
34,506
6,430
7,349
18.8
19.5
6.4
7.7
41.8
34.7
12.6
10.6
33.2
32.5
5.1
4.4
Nestle*
Neutral
6,429
-
61,986
10,073
11,807
20.7
21.5
124.8
154.2
51.5
41.7
21.2
19.0
34.8
36.7
5.9
5.0
Tata Global
Neutral
125
-
7,914
8,675
9,088
9.8
9.8
7.4
8.2
17.0
15.3
1.9
1.8
7.9
8.1
0.8
0.8
Procter & Gamble
Neutral
6,990
-
22,689
2,939
3,342
23.2
23.0
146.2
163.7
47.8
42.7
107.0
102.6
25.3
23.5
7.4
6.4
Hygiene
Stock Watch
November 11, 2016
Company Name
Reco
CMP
Target
Mkt Cap
Sales ( Čcr )
OPM(%)
EPS (Č)
PER(x)
P/BV(x)
RoE(%)
EV/Sales(x)
(Č)
Price ( Č)
( Č cr )
FY17E FY18E
FY17E
FY18E
FY17E
FY18E
FY17E
FY18E
FY17E
FY18E
FY17E
FY18E
FY17E
FY18E
IT
HCL Tech^
Buy
788
1,000
111,189
49,242
57,168
20.5
20.5
55.7
64.1
14.2
12.3
2.9
2.2
20.3
17.9
2.1
1.7
Infosys
Buy
939
1,249
215,591
68,350
77,326
27.0
27.0
62.5
69.4
15.0
13.5
3.2
2.9
21.3
21.6
2.7
2.3
TCS
Buy
2,158
2,620
425,228
119,025
133,308
27.6
27.6
131.2
145.5
16.5
14.8
5.3
4.9
32.4
33.1
3.4
3.0
Tech Mahindra
Buy
442
600
42,910
29,673
32,937
15.5
17.0
32.8
39.9
13.5
11.1
2.6
2.3
19.6
20.7
1.2
1.0
Wipro
Buy
445
590
108,094
55,440
60,430
18.1
18.1
35.9
39.9
12.4
11.2
2.2
2.0
19.0
19.3
1.7
1.5
Media
D B Corp
Neutral
377
-
6,932
2,297
2,590
27.4
28.2
21.0
23.4
18.0
16.1
4.2
3.6
23.7
23.1
2.8
2.4
HT Media
Neutral
81
-
1,878
2,693
2,991
12.6
12.9
7.9
9.0
10.2
9.0
0.9
0.8
7.8
8.3
0.3
0.2
Jagran Prakashan
Buy
187
225
6,126
2,355
2,635
28.0
28.0
10.8
12.5
17.4
15.0
3.8
3.3
21.7
21.7
2.6
2.3
Sun TV Network
Neutral
533
-
21,009
2,850
3,265
70.1
71.0
26.2
30.4
20.4
17.5
5.2
4.6
24.3
25.6
6.6
5.6
Hindustan Media
Neutral
294
-
2,158
1,016
1,138
24.3
25.2
27.3
30.1
10.8
9.8
2.1
1.8
16.2
15.8
1.4
1.2
Ventures
TV Today Network
Buy
337
385
2,012
637
743
27.5
27.5
18.4
21.4
18.4
15.8
3.2
2.7
17.4
17.2
2.7
2.2
Metals & Mining
Coal India
Neutral
334
-
210,651
84,638
94,297
21.4
22.3
24.5
27.1
13.6
12.3
5.7
5.4
42.6
46.0
1.9
1.7
Hind. Zinc
Neutral
259
-
109,309
14,252
18,465
55.9
48.3
15.8
21.5
16.4
12.0
2.7
2.3
17.0
20.7
7.5
5.8
Hindalco
Neutral
175
-
36,230
107,899
112,095
7.4
8.2
9.2
13.0
19.1
13.5
0.9
0.9
4.8
6.6
0.8
0.8
JSW Steel
Neutral
1,759
-
42,510
53,201
58,779
16.1
16.2
130.6
153.7
13.5
11.4
1.8
1.6
14.0
14.4
1.5
1.3
NMDC
Neutral
131
-
41,352
6,643
7,284
44.4
47.7
7.1
7.7
18.4
17.0
1.6
1.6
8.8
9.2
3.7
3.3
SAIL
Neutral
53
-
21,786
47,528
53,738
(0.7)
2.1
(1.9)
2.6
20.3
0.6
0.6
(1.6)
3.9
1.3
1.2
Vedanta
Neutral
229
-
67,980
71,744
81,944
19.2
21.7
13.4
20.1
17.1
11.4
1.5
1.3
8.4
11.3
1.3
1.0
Tata Steel
Neutral
437
-
42,428
121,374
121,856
7.2
8.4
18.6
34.3
23.5
12.7
1.5
1.3
6.1
10.1
1.0
0.9
Oil & Gas
Cairn India
Neutral
254
-
47,565
9,127
10,632
4.3
20.6
8.8
11.7
28.8
21.7
0.9
0.9
3.3
4.2
6.4
5.4
GAIL
Neutral
449
-
56,993
56,220
65,198
9.3
10.1
27.1
33.3
16.6
13.5
1.5
1.4
9.3
10.7
1.2
1.0
ONGC
Neutral
276
-
236,046
137,222
152,563
15.0
21.8
19.5
24.1
14.2
11.5
1.2
1.1
8.5
10.1
2.0
1.8
Indian Oil Corp
Neutral
320
-
155,535
373,359
428,656
5.9
5.5
54.0
59.3
5.9
5.4
0.9
0.8
16.0
15.6
0.6
0.5
Reliance Industries
Neutral
1,010
-
327,487
301,963
358,039
12.1
12.6
87.7
101.7
11.5
9.9
1.2
1.1
10.7
11.3
1.6
1.3
Pharmaceuticals
Alembic Pharma
Neutral
655
-
12,352
3,483
4,083
20.2
21.4
24.3
30.4
27.0
21.6
6.1
4.9
25.5
25.3
3.4
2.8
Aurobindo Pharma
Buy
790
877
46,255
15,720
18,078
23.7
23.7
41.4
47.3
19.1
16.7
5.0
3.9
29.6
26.1
3.1
2.6
Aventis*
Neutral
4,265
-
9,823
2,277
2,597
17.3
18.3
149.4
172.0
28.6
24.8
4.7
3.8
25.1
28.8
3.9
3.2
Cadila Healthcare
Neutral
401
-
41,067
10,429
12,318
22.6
22.0
16.9
19.2
23.7
20.9
6.0
4.9
28.5
25.7
3.8
3.1
Cipla
Neutral
564
-
45,341
15,378
18,089
17.4
18.4
21.6
27.2
26.1
20.7
3.4
2.9
13.7
15.2
3.0
2.5
Stock Watch
November 11, 2016
Company Name
Reco
CMP
Target
Mkt Cap
Sales ( Čcr )
OPM(%)
EPS (Č)
PER(x)
P/BV(x)
RoE(%)
EV/Sales(x)
(Č)
Price ( Č)
( Č cr )
FY17E FY18E
FY17E
FY18E
FY17E
FY18E
FY17E
FY18E
FY17E
FY18E
FY17E
FY18E
FY17E
FY18E
Pharmaceuticals
Dr Reddy's
Neutral
3,274
-
54,250
16,043
18,119
20.8
22.4
112.4
142.9
29.1
22.9
3.9
3.4
14.1
15.9
3.4
3.0
Dishman Pharma
Neutral
242
-
3,908
1,718
1,890
22.7
22.8
9.5
11.3
25.5
21.4
2.5
2.2
10.1
10.9
2.7
2.4
GSK Pharma*
Neutral
2,616
-
22,162
3,000
3,312
15.4
20.6
46.5
60.8
56.3
43.0
13.5
13.5
26.3
30.6
7.2
6.6
Indoco Remedies
Neutral
295
-
2,715
1,112
1,289
18.2
18.2
13.2
15.6
22.3
18.9
4.0
3.4
19.2
19.2
2.5
2.1
Ipca labs
Neutral
593
-
7,476
3,303
3,799
15.3
15.3
17.3
19.7
34.3
30.1
3.0
2.7
9.1
9.4
2.4
2.1
Lupin
Buy
1,493
1,809
67,319
15,912
18,644
26.4
26.7
58.1
69.3
25.7
21.6
5.0
4.1
21.4
20.9
4.4
3.6
Sun Pharma
Buy
667
944
160,514
31,129
35,258
30.0
30.9
28.0
32.8
23.8
20.3
3.7
3.0
18.7
18.9
4.7
4.0
Power
Tata Power
Neutral
74
-
20,136
36,916
39,557
17.4
27.1
5.1
6.3
14.6
11.8
1.3
1.2
9.0
10.3
1.5
1.4
NTPC
Neutral
155
-
127,640
86,605
95,545
17.5
20.8
11.8
13.4
13.1
11.6
1.3
1.2
10.5
11.1
2.8
2.8
Power Grid
Neutral
188
-
98,537
25,763
29,762
74.3
73.1
14.8
17.3
12.7
10.9
2.0
1.8
16.9
17.5
7.9
7.5
Real Estate
Prestige Estate
Buy
172
210
6,452
4,707
5,105
25.2
26.0
10.3
13.0
16.7
13.2
1.3
1.2
10.3
10.2
2.6
2.3
MLIFE
Buy
414
522
1,700
1,152
1,300
22.7
24.6
29.9
35.8
13.9
11.6
1.0
1.0
7.6
8.6
2.2
1.8
Telecom
Bharti Airtel
Neutral
308
-
123,200
105,086
114,808
34.5
34.7
12.2
16.4
25.3
18.8
1.7
1.6
6.8
8.4
2.1
1.8
Idea Cellular
Neutral
73
-
26,286
40,133
43,731
37.2
37.1
6.4
6.5
11.4
11.2
1.0
0.9
8.2
7.6
1.7
1.4
zOthers
Abbott India
Neutral
4,725
-
10,041
3,153
3,583
14.1
14.4
152.2
182.7
31.1
25.9
152.4
130.2
25.6
26.1
2.9
2.5
Asian Granito
Buy
258
351
776
1,071
1,182
12.1
12.4
12.7
16.0
20.3
16.1
1.9
1.7
9.5
10.7
1.0
0.9
Bajaj Electricals
Buy
231
306
2,333
5,099
5,805
5.6
5.9
11.4
14.6
20.3
15.8
2.7
2.4
13.4
15.1
0.5
0.4
Banco Products (India)
Neutral
205
-
1,466
1,353
1,471
12.3
12.4
14.5
16.3
14.1
12.6
19.5
17.6
14.5
14.6
1.0
105.3
Coffee Day Enterprises
Neutral
221
-
4,549
2,964
3,260
20.5
21.2
4.7
8.0
-
27.6
2.6
2.3
5.5
8.5
1.9
1.7
Ltd
Competent Automobiles Neutral
186
-
114
1,137
1,256
3.1
2.7
28.0
23.6
6.6
7.9
35.8
32.3
14.3
11.5
0.1
0.1
Elecon Engineering
Neutral
58
-
630
1,482
1,660
13.7
14.5
3.9
5.8
14.8
10.0
3.5
3.2
7.8
10.9
0.8
0.7
Finolex Cables
Neutral
425
-
6,498
2,883
3,115
12.0
12.1
14.2
18.6
29.9
22.8
15.9
13.9
15.8
14.6
1.9
1.7
Garware Wall Ropes
Neutral
558
-
1,221
873
938
12.9
13.1
30.9
34.9
18.1
16.0
2.8
2.4
15.7
15.2
1.3
1.2
Goodyear India*
Neutral
790
-
1,822
1,598
1,704
10.4
10.2
49.4
52.6
16.0
15.0
73.8
64.8
18.2
17.0
0.8
113.5
Hitachi
Neutral
1,410
-
3,834
2,081
2,433
8.8
8.9
33.4
39.9
42.2
35.3
34.1
28.4
22.1
21.4
1.9
1.6
HSIL
Neutral
344
-
2,486
2,384
2,515
15.8
16.3
15.3
19.4
22.5
17.7
22.3
19.2
7.8
9.3
1.2
1.1
Interglobe Aviation
Neutral
937
-
33,753
21,122
26,005
14.5
27.6
110.7
132.1
8.5
7.1
50.6
36.2
168.5
201.1
1.6
1.3
Jyothy Laboratories
Neutral
369
-
6,694
1,440
2,052
11.5
13.0
8.5
10.0
43.4
36.9
10.5
9.7
18.6
19.3
4.8
3.4
Kirloskar Engines India
Neutral
350
-
5,061
2,554
2,800
9.9
10.0
10.5
12.1
33.3
28.9
13.9
13.2
10.7
11.7
1.6
1.4
Ltd
Stock Watch
November 11, 2016
Company Name
Reco
CMP
Target
Mkt Cap
Sales ( Čcr )
OPM(%)
EPS (Č)
PER(x)
P/BV(x)
RoE(%)
EV/Sales(x)
(Č)
Price ( Č)
( Č cr )
FY17E
FY18E
FY17E
FY18E
FY17E
FY18E
FY17E
FY18E
FY17E
FY18E
FY17E
FY18E
FY17E
FY18E
zOthers
Linc Pen & Plastics
Neutral
251
-
371
382
420
9.3
9.5
13.5
15.7
18.6
16.0
3.2
2.8
17.1
17.3
1.0
0.9
M M Forgings
Neutral
428
-
517
546
608
20.4
20.7
41.3
48.7
10.4
8.8
58.6
51.9
16.6
17.0
0.8
0.7
Manpasand Bever.
Neutral
701
-
4,006
836
1,087
19.6
19.4
16.9
23.8
41.5
29.4
5.0
4.3
12.0
14.8
4.5
3.4
Mirza International
Buy
89
113
1,071
1,024
1,148
18.0
18.0
6.9
8.0
12.9
11.1
2.2
1.8
16.6
16.2
1.2
1.1
MT Educare
Neutral
131
-
523
366
417
17.7
18.2
9.4
10.8
14.0
12.2
3.1
2.7
22.2
22.3
1.3
1.1
Narayana Hrudaya
Neutral
354
-
7,236
1,873
2,166
11.5
11.7
2.6
4.0
133.9
89.3
8.2
7.4
6.1
8.3
3.8
3.3
Navkar Corporation
Buy
194
265
2,761
408
612
42.9
42.3
6.8
11.5
28.6
16.8
2.0
1.8
6.9
10.5
7.5
5.0
Navneet Education
Neutral
103
-
2,451
1,062
1,147
24.0
24.0
6.1
6.6
16.9
15.5
3.5
3.1
20.6
19.8
2.3
2.1
Nilkamal
Neutral
1,505
-
2,246
1,995
2,165
10.7
10.4
69.8
80.6
21.6
18.7
86.0
74.7
16.6
16.5
1.1
1.0
Page Industries
Neutral
14,978
-
16,706
2,450
3,124
20.1
17.6
299.0
310.0
50.1
48.3
333.6
254.6
47.1
87.5
7.4
5.8
Parag Milk Foods
Neutral
303
-
2,552
1,919
2,231
9.3
9.6
9.5
12.9
32.1
23.5
5.0
4.1
15.5
17.5
1.5
1.3
Quick Heal
Neutral
237
-
1,663
408
495
27.3
27.0
7.7
8.8
30.7
27.0
2.8
2.9
9.3
10.6
3.1
2.5
Radico Khaitan
Accumulate
124
147
1,654
1,667
1,824
13.0
13.2
6.7
8.2
18.7
15.2
1.7
1.5
9.0
10.2
1.4
1.3
Relaxo Footwears
Neutral
410
-
4,926
2,085
2,469
9.2
8.2
7.6
8.0
54.3
51.6
21.1
18.0
17.9
18.8
2.4
2.0
S H Kelkar & Co.
Neutral
305
-
4,411
1,036
1,160
15.1
15.0
6.1
7.2
50.0
42.5
5.3
4.9
10.7
11.5
4.0
3.5
Siyaram Silk Mills
Accumulate
1,383
1,714
1,297
1,799
2,040
11.6
11.7
104.9
122.4
13.2
11.3
2.2
1.9
16.4
16.4
0.9
0.8
Styrolution ABS India*
Neutral
610
-
1,073
1,440
1,537
9.2
9.0
40.6
42.6
15.0
14.3
38.4
34.9
12.3
11.6
0.7
0.6
Surya Roshni
Neutral
221
-
968
3,342
3,625
7.8
7.5
17.3
19.8
12.8
11.2
24.3
19.5
10.5
10.8
0.5
0.5
Team Lease Serv.
Neutral
996
-
1,702
3,229
4,001
1.5
1.8
22.8
32.8
43.7
30.3
4.7
4.1
10.7
13.4
0.4
0.3
The Byke Hospitality
Neutral
184
-
736
287
384
20.5
20.5
7.6
10.7
24.2
17.2
5.0
4.1
20.7
23.5
2.5
1.9
Transport Corporation of
Neutral
186
-
1,428
2,671
2,911
8.5
8.8
13.9
15.7
13.5
11.9
1.8
1.6
13.7
13.8
0.6
0.6
India
TVS Srichakra
Neutral
3,660
-
2,802
2,304
2,614
13.7
13.8
231.1
266.6
15.8
13.7
411.2
323.8
33.9
29.3
1.3
1.1
UFO Moviez
Neutral
480
-
1,325
619
685
33.2
33.4
30.0
34.9
16.0
13.8
2.2
1.9
13.8
13.9
1.9
1.5
Visaka Industries
Neutral
218
-
346
1,051
1,138
10.3
10.4
21.0
23.1
10.4
9.4
27.9
26.1
9.0
9.2
0.6
0.6
VRL Logistics
Neutral
286
-
2,611
1,902
2,119
16.7
16.6
14.6
16.8
19.6
17.0
4.3
3.8
21.9
22.2
1.5
1.3
Wonderla Holidays
Neutral
368
-
2,081
287
355
38.0
40.0
11.3
14.2
32.6
25.9
4.7
4.1
21.4
23.9
7.1
5.7
Source: Company, Angel Research; Note: *December year end; #September year end; &October year end; Price as on November 10, 2016
Market Outlook
November 11, 2016
Research Team Tel: 022 - 39357800
DISCLAIMER
Angel Broking Private Limited (hereinafter referred to as “Angel”) is a registered Member of National Stock Exchange of India
Limited,Bombay Stock Exchange Limited and Metropolitan Stock Exchange Limited. It is also registered as a Depository Participant with
CDSL and Portfolio Manager with SEBI. It also has registration with AMFI as a Mutual Fund Distributor. Angel Broking Private Limited is a
registered entity with SEBI for Research Analyst in terms of SEBI (Research Analyst) Regulations, 2014 vide registration number
INH000000164. Angel or its associates has not been debarred/ suspended by SEBI or any other regulatory authority for accessing
/dealing in securities Market. Angel or its associates/analyst has not received any compensation / managed or
co-managed public offering of securities of the company covered by Analyst during the past twelve months.
This document is solely for the personal information of the recipient, and must not be singularly used as the basis of any investment
decision. Nothing in this document should be construed as investment or financial advice. Each recipient of this document should make
such investigations as they deem necessary to arrive at an independent evaluation of an investment in the securities of the companies
referred to in this document (including the merits and risks involved), and should consult their own advisors to determine the merits and
risks of such an investment.
Reports based on technical and derivative analysis center on studying charts of a stock's price movement, outstanding positions and
trading volume, as opposed to focusing on a company's fundamentals and, as such, may not match with a report on a company's
fundamentals. Investors are advised to refer the Fundamental and Technical Research Reports available on our website to evaluate the
contrary view, if any.
The information in this document has been printed on the basis of publicly available information, internal data and other reliable
sources believed to be true, but we do not represent that it is accurate or complete and it should not be relied on as such, as this
document is for general guidance only. Angel Broking Pvt. Limited or any of its affiliates/ group companies shall not be in any way
responsible for any loss or damage that may arise to any person from any inadvertent error in the information contained in this report.
Angel Broking Pvt. Limited has not independently verified all the information contained within this document. Accordingly, we cannot
testify, nor make any representation or warranty, express or implied, to the accuracy, contents or data contained within this document.
While Angel Broking Pvt. Limited endeavors to update on a reasonable basis the information discussed in this material, there may be
regulatory, compliance, or other reasons that prevent us from doing so.
This document is being supplied to you solely for your information, and its contents, information or data may not be reproduced,
redistributed or passed on, directly or indirectly.
Neither Angel Broking Pvt. Limited, nor its directors, employees or affiliates shall be liable for any loss or damage that may arise from
or in connection with the use of this information.